The Fall Channel
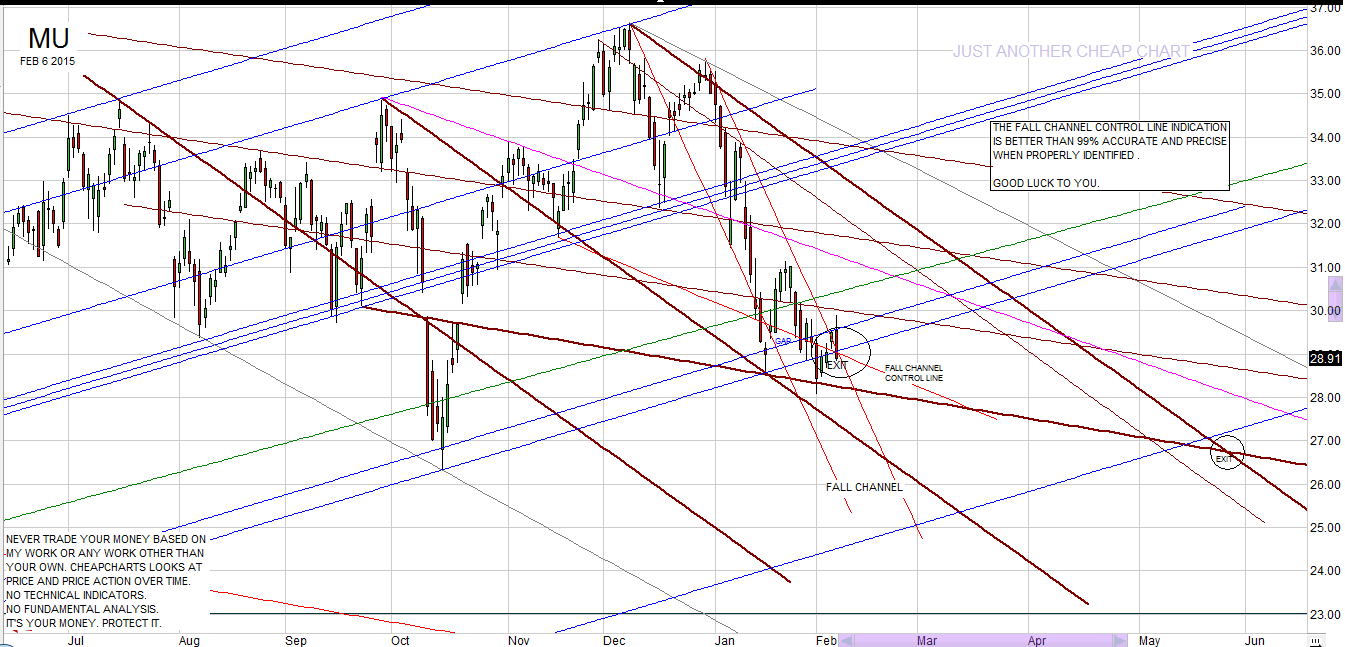 Once price reaches the pinnacle of a parabolic peak, it will fall until it finds a force strong enough to stop the fall. Nothing travels in a straight line when multiple forces act upon it, so price falls over time in fits and spurts. This time could last for days, weeks, or months. As price falls and rises, falls and rises, each time setting lower lows and lower highs, a channel is formed which we call the Fall Channel.
Recognizing the Fall Channel is sometimes not as easy as you would think. There are several ways to find the correct lines, and on some stocks you might have to try every one of them to find the final model. Like all lines of force, these lines should never be the result of a guess. It is hard to get the Fall Channel lines drawn with accuracy and precision, but it can be done with practice.
If your Fall Channel is drawn incorrectly, your Fall Channel CrossPeak Control Lines will expose it. Properly drawn Fall Channel lines can give you a good idea when trying to time expectations of a reversal after a parabolic peak and fall.
Note that I am not saying you can call a bottom with this artifact, but rather that you can estimate with some precision the probable exit of price from the parabolic blowoff. Price may rebound a short time and then resume its fall, or it might continue or begin a new uptrend. We do not know from the model which will happen.
You can never predict the future with any technique or method known. But the future and the past intersect in the present, and probabilities can be estimated. The Fall Channel ties the rise prior to the peak, the peak, and the post-peak fall, into a coherent whole artifact.
When you draw your Fall Channel you will use one of several methods. After the peak you will wait for price to decline until it finds support and trades generally sideways for several days, then falls suddenly.
The simplest Fall Channel line is drawn from the peak through the sub-peak of this last day before the fall resumes. Extend that line all the way down to a major support line.
Don’t worry if that seems a long way to fall. Right now we don’t have any clue how far down we’re heading, so we just draw the line.
Now, duplicate that line and lay it just over the lowest low you see right after the peak. This is usually the day when price decided to stop falling and trade in that little sideways trek. Drop the line in its place and step back.
Right now, that is your Fall Channel. And it’s doing you no good at all. We need to add the Fall Channel Control Line to learn anything from all this, so let’s take a look at it.
To get some use out of the Fall Channel, we have to add one more line: the Fall Channel Control Line. There are actually two types of control lines that can appear with the Fall Channel. The Cross-Peak version has an origin before the peak, while the plain Fall Channel Control Line is strictly an internal affair, deriving all it’s reference points from inside the channel.
You cannot draw either version of this line until price has dropped from that sub-peak we used to create the channel itself, and found its next support below. You’ll see this because once again, price will begin to travel generally sideways or even up for a few days. Once we have this price point set, we can verify our channel and draw the control line.
Verify the channel by looking at where that second Low occurs in relationship to the left rail of the Fall Channel. It does not need to be perfect here – does it make any sense to you at all there when you look at the lines? If it doesn’t then you may have to use a different method of creating the Fall Channel. We’ll talk about that in a bit.
Let me explain why the lines don’t absolutely have to be perfect at this point. It’s the Fall Channel itself – it’s still being created at this point and so it is impossible to accurately model the thing. We can only see it up to Now. But like so many other things, if we see enough of it, and we are familiar with the type of thing we’re seeing, we can estimate the finished artifact.
Assuming your channel lines look good to you, we can move on and draw the CrossPeak version of the control line. Study the price movements leading up to the parabolic peak, paying attention in particular to the little smaller peaks along the final stages of the rise.
Find the first sub-peak prior to the top peak, one which has an obvious and easily discernable retreat to a distinct bottom, before price rises quickly to the very top. Sometimes this Low is on the day of, or the day before the peak.
That distinct bottom, the last Low before the final Peak, is where you begin drawing the CrossPeak Control Line. You will draw it from that Low, through the exact point where the first fall after the peak touches the left rail of the Fall Channel. Sometimes you will use the Low from that day instead of the intersection of price at the left rail. You may want to try them both at first, to see which works. Continue the line all the way across the Fall Channel until it comes out the other side.
It should be obvious but I will state it plainly: the Low you choose in your Fall Channel must be lower in price that the originating point. If the first available price point on your fall channel is higher than the originating Low prior to the peak, then move down to the next available point on the left rail and draw the line through it instead.
Of course, this may indicate your Fall Channel is drawn incorrectly, so check that if this happens to your model.
When the rules fail, always recheck the model. They’re called rules for a reason, and though they do sometimes fail, it is rare. Always check for something you may have missed.
the rest of the article appears in the ebook…