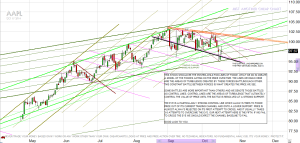
Modeling Forces, Not Charting Prices
When modeling lines of force it is important to always remember that there are only two kinds of forces: upward forces and downward forces. There are no diagonal forces, or any forces in any other direction you can come up with. It really is that simple.
None of your lines of force will appear in a perfectly upward or downward direction on the model. Lines of force interact with each other over time, either adding to or subtracting from the overall upward or downward energies along developing lines of turbulence. These lines of turbulence are what we draw on our models.
We recognize these lines of turbulence in the way price reacts to them. Using data points of Open, Close, High and Low for each time period we can plot coincidental lines and expose where these turbulent areas reside on the model. The lines drawn must be precise to be accurate. There can be no ‘fudge’ area. The force line is either there or it is not there. There is no in between.

Coincidental lines are just that. To the uninitiated, they look possibly random. It definitely is a coincidence that peaks and valleys appear to ‘line up’. But that coincidental nature does not detract at all from the effectiveness of modeling lines of force. One coincidence is a fluke, two are interesting. Repeated regularly across time? Ignore it at your own risk.
We are using data points of price, but we are modeling the lines of turbulence between forces acting on the price. It does not matter at all what is the root cause of any, or all of these forces. We know that each one will be an upward force or a downward force and for our purposes, that is all that matters.
Rumors abound both bearish and bullish on every stock I have ever looked at. Insider sales. Illegal manipulation. Management can and/or cannot be trusted. Analysts suck. And don’t get me started with HFT and legalized scamming in the market/casino.
All of it, everything is reflected in the stock price. Those four data points tell us daily everything we need to know. If a new force appears, you can bet it will show up in the price data within moments of becoming known, or even suspected. We may not know it by its name, but we can point to it and know it is there by the way price reacts.
Always remember though, that it is not price itself we are modeling. We are finding the forces behind the price. Price is just the raw data we use to find those forces. It is totally possible to draw the model perfectly, finding all the major forces accurately, and still misinterpret the result due to our own bias.
Focus on the forces, not the prices.