GTAT – EXPERIMENTAL TRIPLE PEAK FALL CHANNEL – 100614
Sometimes something happens that nobody saw coming (outside select circles, I am sure). Today was such a day for GTAT. I’ll ignore the reasons, I’ll ignore AAPL and I’ll ignore everything else fundamental here. The force of today’s action speaks for itself on the model.
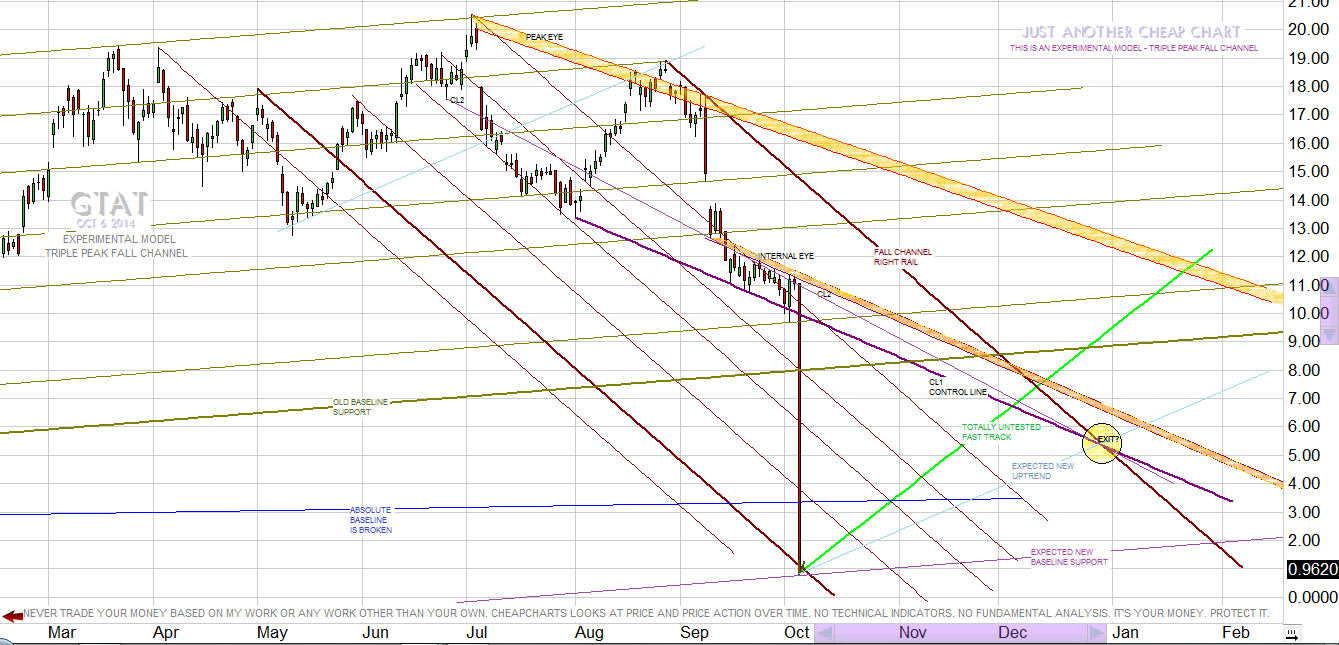 Remember as we go through this that this is an experimental model of a triple peak Fall Channel. Yesterday’s model used two peaks from this head and shoulders pattern and yielded less than desirable results (although an early version of that model implied a drop to around 3 bucks. Stupidly, my bias made me disbelieve that result.)
I have removed most of the old generally downward force lines. Obviously there are much stronger downward forces at play. As time moves forward the weak downward forces will again become apparent and we’ll add them again then. Right now I want this model to be as clear as possible. I do expect it to evolve over time, especially the next week, as forces reach a sustainable equilibrium.
In all my previous models I have included a blue line across the bottom of the chart. This line showed the absolute bottom expected in any sudden drop and is drawn across the long term lows. Price tumbled through it today as if it weren’t even there. I expected that line to catch price if something like this happened.
I think I will find as I refine this model that the line which caught price today emanates from the peak of the left shoulder and passes through today’s low. The model shown here has the Fall Channel drawn using the right shoulder peak resistance as the right rail (standard). The alternate method would have me create the left rail first and use it as the basis for the Fall Channel. Using the alternate method would lead the right rail down at a slightly less steep angle, moving the intersection with the Control Line slightly right on the chart, lowering the target value and lengthening the target time.
There are actually four Control Lines within the Fall Channel, two of them forming the Internal Eye. The other two Control Lines are remarkable in that they both point to the same area for an exit from this channel. It is this coincidence that makes me bullish on GTAT.
The expected baseline support is simply a reflection of the old longterm baseline, lowered to our new trading level. The expected new uptrend is simply a reflection of previous uptrend lines. The totally untested fast track is again just a reflection of earlier fast tracks.
One of the primary concepts driving Lines Of Force is that forces are active across the entire model. They never go away. Different forces may be in control of the price at different times, but the forces are there, battling it out behind the scenes. When this stock starts to recover whether because of somebody throwing a dead cat really hard or because the future requires shades, price will be driven by the same forces as before.
I guess what I’m saying here is that for an astute trader there is money to be grabbed by the fistfuls here. If you have the time, and the stomach for it, this could return anywhere from 100% to 500% in just a few months. Or it could go bust, fail at reorganization and disappear with all your cash.
As always, this is a gamble. I’m in long and deep as of Tuesday.
As always, good luck to you.
update:Closed position on Wednesday ahead of Thursday’s hearing. (.94<1.69) Almost forgot to hawk my ebook Introduction To Lines Of Force. Click the “Web advertisement” upper right of this page to see why you want this thing.