The Eye
 The Eye is the single most powerful downward artifact on the chart. While it may not control the price downward like a control line does, it instead seems to erect an impenetrable wall of thick turbulence against a rising price. Several attempts usually must be made before price is able to cross the Eye and it can take days, weeks or even months between each attempt. Such being the case, it behooves us to learn to spot it.
Identifying The Eye
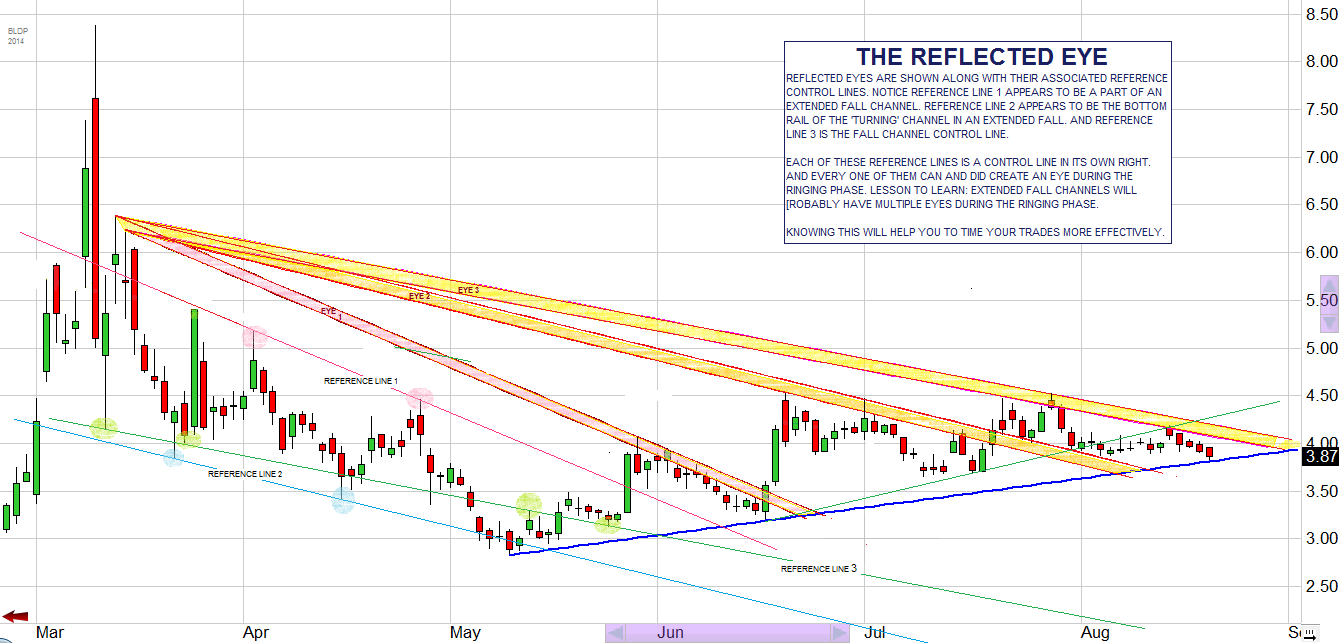
As I keep reminding in each section, what we are doing here is charting lines of force acting on price over time. We are looking for the areas where those forces meet and create turbulence. The most common appearance of the Eye is formed when a reflection line appears very close to a strong Control line. The end result is a thick area of turbulence that acts as a barrier to a rising price.
The top line of the Eye is almost always a control line that has been adjusted over time as each new peak and trough are played through. You could argue that each control line is in fact the top rail of its own Eye and technically you would be somewhat correct, but mostly wrong. Not all Control lines have a reflection close enough to form the lower rail of the Eye, and Peak Eye has no true control line at all, so it’s best to keep them separate in your mind.
The Eye can seem to be quite complex. The theory behind it is very simple however. Let’s fall back a bit and review.
When we are charting lines of force, what we are actually doing is exposing the most turbulent areas where the upward and downward forces meet. In truth, these forces are always and everywhere acting against each other, but we are finding the major ‘battle lines’ these forces have developed over time.
As you might expect, some of these battles are more intense than others. And as we know, at times one line may indicate a strong battle and at other times the same line is weak. The forces are valid across the chart, but the focus of their interactions against each other move from line to line across time.
So we see that at times a forceline may have very little turbulence, and at other times the turbulence of that line may be massive. We’re not talking about the thickness of the actual line on the chart, but the depth of turbulence that the line may represent. We may determine how thick the line appears on the chart, but we are only observers of the action. We do not decide how strong a force the line represents. We can only observe and try to report the action accurately.
Imagine that each force is an army, and at times they’re just posting border patrols against each other, keeping the line at a one to one ratio. And then along comes some reinforcement from the downward side, which is soon matched by more reinforcements. Now we have our ‘troops’ standing two men deep. As more and more troops arrive our downward forces have multiplied and the area required for them increases in depth until we have our troops standing in rows one hundred deep.
 Meanwhile, the upward forces see only the border patrol. The downward forces are hidden away, ready to strike back at any attempt to cross the line. The massive downward army repels each successive attempt. The upward army takes time to build up its forces enough to try one final attempt. They either succeed and move beyond the Eye or else it destroys them, and price tumbles.
The turbulence we are showing in the Eye is similar to this. Keeping with our war metaphor, the Eye shows a major buildup of the downward forces in advance of the upward response. In fact, usually the Eye presents itself as just another Control line – nothing special. It is only after it has wreaked its havoc on price that we recognize how strong it really is.
Almost every Eye contains a Control line and the ones that do not are based on reflections of control lines. Recall that the Control line always leads price down to a strong uptrend line. The Eye tries to force price BELOW the uptrend. In a sense, it builds a wall against upward price movement.
It usually takes several attempts to overcome the force of the Eye. These attempts can occur in rapid succession or months can pass between each. When dealing with the Eye you may see the price languish for longer than you are willing to wait.
The Eye is completed in one of two ways. In the first and most common way, a triangle is observed to form a wedge between the Eye and a strong upward force line. Price will work through the wedge and either successfully cross it or will be forced down into a lower trading channel.
Or you may see price immediately reject the Eye and fall to the upward force line. It will trade relatively flat for a few days and then mount an offensive against the Eye. Price will approach the eye very decisively, with strong green candles, for a couple of days and then gap across the entire Eye on a new upswing.
You can seldom know which method will complete the Eye just from looking at your chart. It is an extremely strong downward force. It is best to be cautious any time you identify the Eye.
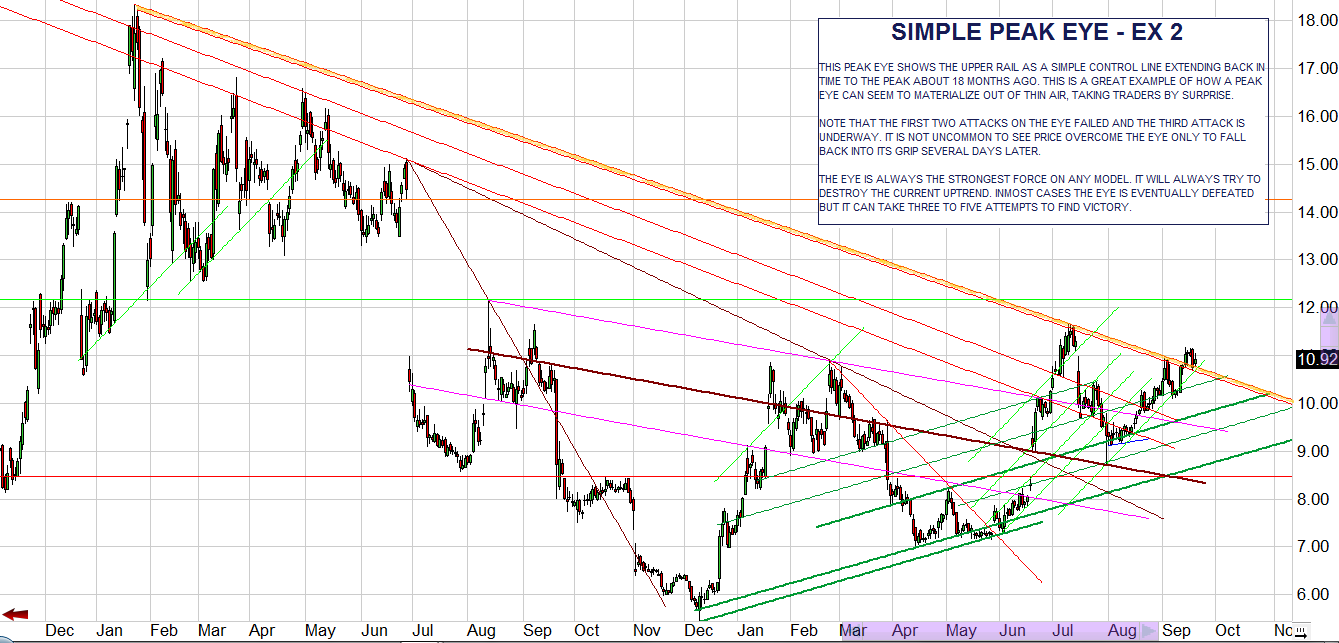
 Once a chart forms an Eye and completes it, you should be on the lookout for another forming Eye at a higher price level. This second Eye may originate from the same source wicks, or it may appear originating from wicks at higher and previous price levels than the first Eye. A stock that forms an Eye will form another Eye at some point in time before the next parabolic peak. Knowing where this resides on your chart should help time your trades into and out of the stock as it rises to its next peak.
The Obvious Eye
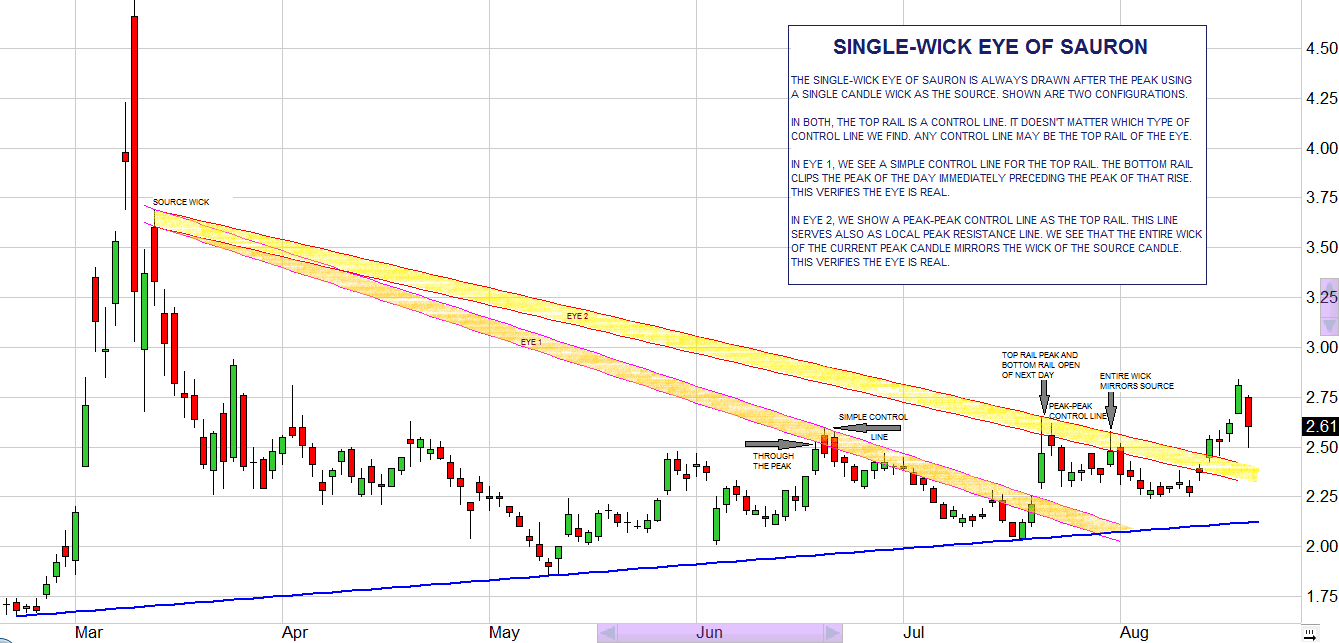
The most easily recognized Eye appears after a peak and subsequent bottom is established. The price tries to rebound and rises within a day or two to a new peak substantially lower than the previous one. That peak is the beginning of the top line of the Eye. You cannot draw the line yet, though. After some time has passed, perhaps a couple of weeks, several peaks and troughs have been established. Your post peak chart should show some organization with a control or rail line drawn through the last peak.
That control line started from the subpeak established from the peak’s bottom, less than a few days after the fall. Either the day before or the day after, there may be another candle that tops out very close to that one. If not, your subpeak candle may have long wicks at the top or bottom, or the candle itself may be long with small wicks. It doesn’t matter which you’ve got. Duplicate that control line and place it on the high from the day before, or the day after.
Examine how that placement fits in with everything else on the chart. Sometimes a control line acts alone, and there is no Eye. If that is the case, your duplicate line will not really ‘fit’ across the chart and you can remove it. Other times, as soon as you place the line you can see the effect the Eye has had on price, and you know your duplicate line is real.
It’s easy to recognize the eye. You will see the top line touch across the tops of one or more subsequent wicks, and the lower line will cross those points exactly at the base of the wick. If it’s real then you want to leave it. You might even want to highlight it in some way. It will be a great obstacle to a rising price.