Peak Resistance Lines
What is really important about the peak phenomenon is that it creates a force of its own, independent of all other forces.
When charting lines of force one of the strongest you will encounter is the downward force of a peak in price. If the peak is the result of a blow-off type of rise, very parabolic in nature, that force at the peak is nearly one hundred percent downward at a ninety degree angle to the time axis. Lets examine what happens.
Price moves upward as the forces beneath it combine into one overwhelming force that rises past immediate resistive forces. As this upward force builds, price moves faster and faster upward until it finally is moving nearly straight up on a daily chart. Apparently nothing can stop its rise to infinity.
Nothing needs to stop it. Like every force in nature that we can measure, this one is only so strong and no stronger. The force interacts with price and if price responds, some small energy of the force is imparted to the price. Eventually the force has imparted all its energy to price and it will stop of its own accord, regardless of whether there is any other force acting on it. There is no further upward force. In the absence of upward force, all remaining forces are negative.
Price is sitting way up there on the peak of this enormous force that it has stretched out across levels until all the force is played out underneath. It would continue to go higher but it has taken those little pieces of energy from the force at each step along the way to get to where it is, which now is on a precipice. There is no more upward force left and so price must either remain where it is, or it must drop.
It must drop and here is why. If it doesn’t, nobody wins. Longs don’t win. Shorts don’t win. Market makers don’t win. And if nobody wins the game, nobody plays. Game Over.
So price goes down, and it goes down hard. Everywhere it can, it stops to grab some of that upward energy it left behind on its rise. Quickly it returns to where there are a jumble of forces and it grabs energy from those as well. When it collects enough energy to counteract the force of its fall, it stops and rebounds a short time. Then it begins another fall, less steep this time.
Every stock that reaches a parabolic peak will react this way and from the standpoint of lines of force, this is as good an explanation as any. What is really important about the peak phenomenon is that it creates a force of its own, independent of all other forces.
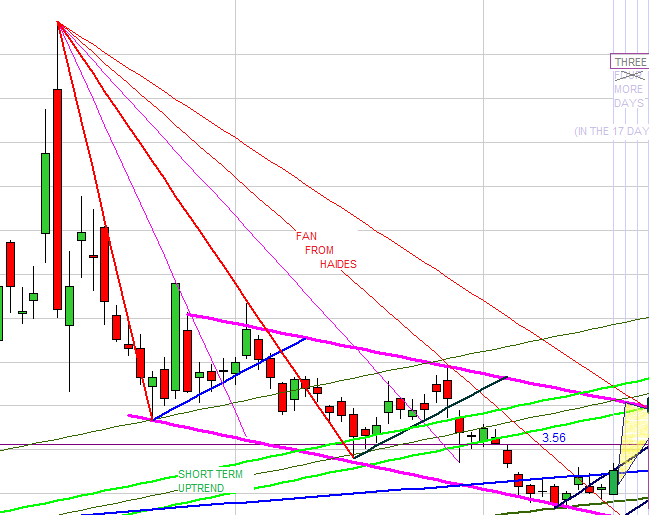
After a parabolic peak like the one described above there are always a series of rises and falls I call ringing. As soon as the first one appears, peaks, and begins to fall again, you can draw the first peak resistance line.
Do it as the name implies. Draw a line from the parabolic peak through the latest shorter peak and onward to a support baseline. That is your first peak resistance line. Price will almost always follow it toward the baseline support before turning and heading back up.
After price finds the support baseline it will turn and head up again until it reaches a point somewhat below the last peak, and then it will turn south again. Now you can draw your second peak resistance line. Draw it from the parabolic peak through this latest smaller peak and on toward the support baseline.
Each time price peaks you can draw a new peak resistance line. After the second one you will want to draw a line across the highs and lows of each cycle to see if there is a line of force appearing there. If it appears you can use it as your support baseline for the peak reflections, but don’t ignore the real support baseline.
As price moves further away in time from the parabolic peak, the new peak resistance lines lose some of their force and control lines become very strong. But I have seen many peak resistance lines exert themselves over time spans of years, so don’t ever count them out.
Take a moment and think about something with me. You want to chart lines of force so that you will understand a little more about how a stock’s price might move from day to day or week to week or whatever. You want an idea as to what it might do.
Right there is our first piece of uncertainty and we’d better just accept it. Nobody can foretell the future, as far as I know. Charts will only give us information on the price movements up until the moment we grab the chart. The best we can ever hope to understand is NOW. Tomorrow is always a gamble.
So recognize that there is always uncertainty in our work. The best we can do there is to simply try to mitigate it. Draw our lines carefully and without bias. We cannot afford to let our hopes or our fears affect the lines we draw on our charts. We need to know the truth of it and yes, we can handle it. What we cannot handle is losing money time after time because we didn’t have any grasp on what price might do, and no idea of what it could.
Draw honest lines and make them true. If you settle for approximate lines then you will get approximate results, which is to say, not the results you are hoping for. You may draw a support line that makes you feel good but then when price dips below it you sell to avoid further losses, only to see the stock rise for the next few weeks to what might have been a handsome little profit for you. If only you had drawn accurate lines.
We can only ever hope to understand how we got to where we are. We are not driving this bus. We are passengers and all we want to know is when is a good time to get on or off. We want a schedule. Charting lines of force is about as close to that as I can find. But the lines must be accurate. There is no substitute.